Difference between revisions of "Chem341:NMR workshop"
(→Chemical shift: Add links to answers) |
(→Tables of chemical shifts) |
||
| Line 23: | Line 23: | ||
<center>{{Chem341:HNMR table}}</center> | <center>{{Chem341:HNMR table}}</center> | ||
| + | |||
| + | <center>{{Chem341:CNMR table}}</center> | ||
<center>'''Fig. 3'''</center> | <center>'''Fig. 3'''</center> | ||
Revision as of 03:34, 21 September 2009
This is a workshop introducing the basics of NMR spectroscopy for students of organic chemistry. It is taught as part of the Chemistry 341 course at SUNY Potsdam.
Contents
Introduction
Nuclear Magnetic Resonance (NMR) is a property of the nucleus of an atom, concerned with what is known as nuclear spin (I). This is equivalent to the nucleus acting like a miniature bar magnet. Although isotopes can have a variety of values for I (including zero), the most useful for spectroscopy are those nuclei which have I = 1/2 . Fortunately this includes hydrogen 1 (1H), carbon 13, fluorine 19 and phosphorus 31, so that some of the commonest elements in organic chemistry can be analyzed using NMR.
When a nucleus with I = 1/2 is placed in a magnetic field, it can either align itself with the field (lower energy) or against it (higher energy). If radio waves are applied, nuclei in the lower energy state can absorb the energy and jump to the higher energy state. We can observe either the absorption of energy, or the subsequent release of energy as the nucleus "relaxes" back to the lower energy state. Traditionally this was done by scanning slowly through a range of radio wave frequencies (this is called continuous wave, CW). However this has largely been replaced by the faster Fourier Transform (FT) method where one big, broad pulse of radio waves is used to excite all nuclei, then the results are analyzed by computer.
Chemical shift
In a real molecule, the effective magnetic field "felt" by a particular nucleus (Beff) includes not only the applied field B0, but also the magnetic effect of nearby nuclei and electrons. This causes the signal to absorb at a slightly different frequency than for a single atom; it is convenient to reference this resonant frequency to a standard (usually tetramethylsilane, TMS, defined as zero). When we plot the output from this absorption, we obtain a series of peaks known as an NMR spectrum (or "spectra" if you have more than one spectrum) such as the typical example shown in Fig. 2. The difference (in parts per million, ppm) from the zero point is referred to as the chemical shift (δ). A typical range for δ is around 12 ppm for 1H and around 220 ppm for 13C. It is customary to have the zero point at the right hand end of the spectrum, with numbers increasing to the left ("downfield") as shown in Fig. 2. Typical chemical shift values are shown in Tables 1 & 2, and also Fig. 3.
Examples of NMR spectra
Tables of chemical shifts
Table 1: Characteristic 1H NMR Chemical Shifts Type of Hydrogen
(R=Alkyl, Ar=Aryl)Chemical Shift*
(ppm)Type of Hydrogen
(R=Alkyl, Ar=Aryl)Chemical Shift*
(ppm)(CH3)4Si 0 (by definition) RCH3 0.9 RCH=O 9.5-10.1 RCH2R 1.2-1.4 RCOOH' 10-13 R3CH 1.4-1.7 RCOCH3 2.1-2.3 RCH2I 3.2-3.3 RCOCH2R 2.2-2.6 RCH2Br 3.4-3.5 RCOOCH3 3.7-3.9 RCH2Cl 3.6-3.8 RCOOCH2R 4.1-4.7 RCH2F 4.4-4.5 R2C=CRCHR2 1.6-2.6 RCH2NH2 2.3-2.9 R2C=CH2 4.6-5.0 RCH2OH 3.4-4.0 R2C=CHR 5.0-5.7 RCH2OR 3.3-4.0 RC(triplebond)CH 2.0-3.0 RCH2CH2OR 1.5-1.6 ArCH3 2.2-2.5 R2NH 0.5-5.0† ArCH2R 2.3-2.8 ROH 0.5-6.0† ArH 6.5-8.5
Table 2: Characteristic 13C NMR Chemical Shifts Type of Carbon
(R=Alkyl, Ar=Aryl)Chemical Shift*
(ppm)Type of Carbon
(R=Alkyl, Ar=Aryl)Chemical Shift*
(ppm)RCH3 10-25 RC(triplebond)CR 65-85 RCH2R 20-35 RCH=CHR 120-140 R3CH 25-35 ArylC 120-140 RCH2COR 35-50 RCOOR 160-180 RCH2Br 25-35 RCONR2
(amide)165-180 RCH2Cl 40-45 RCOOH 175-185 RCH2OH 60-70 RCHO 190-205 RCH2OR 65-70 RRCOR 200-215
Exercise 1
Exercise 1. Predict approximate chemical shifts for all the carbon and hydrogen atoms which are explicitly shown in the following molecules:
Once you've worked out the answers, click here to see my estimates.
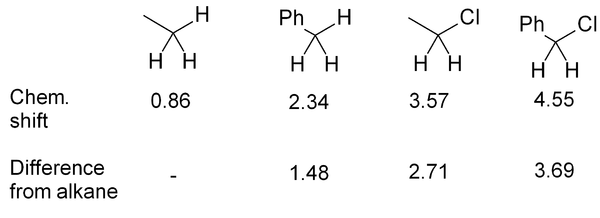
It should be noted that the positions given in Fig. 3 and Tables 1 & 2 may be only approximate, though for simple molecules they are fairly accurate. Where a wide range of δ is observed, this is indicated in Fig. 3 by use of a double-headed arrow showing the range. Additional nearby electron-withdrawing groups will tend to move the signals downfield. Nearby δ bonds may move the signal either upfield (rarely) or downfield (usually), depending on orientation. In 13C spectra steric factors can have a major effect.
If several functional groups are near to a hydrogen, they will each exert an effect, as in this series of related compounds:
Exercise 2
Exercise 2. Predict approximate chemical shifts for all the hydrogen atoms (don't bother with carbon here) which are explicitly shown in the following molecules:
Once you've worked out the answers, click here to see my estimates.
Equivalence
If two or more protons (or indeed with two or more carbons) are in an equivalent environment, then they will have the same chemical shift and appear as one signal. A common example of this is a CH3 group, where all three protons are always equivalent. In a CH2 group, the two protons are also equivalent, unless adjacent to a chiral center. Look for any plane of symmetry in the molecule, which will render the two halves equivalent. In the examples below, the different types of atom are given a subscript; atoms which are equivalent will have the same subscript.
Exercise 3. Predict how many peaks you would expect to see in the 1H and 13C NMR spectra of the following molecules:


