Difference between revisions of "Chem341:NMR workshop"
(→Ethyl 3-chloropropanoate: fmt) |
(→Ethyl 3-chloropropanoate: Try this...) |
||
| Line 140: | Line 140: | ||
===Ethyl 3-chloropropanoate=== | ===Ethyl 3-chloropropanoate=== | ||
[[File:Ethyl3ChloropropionateHNMR.gif|thumb|center|600px|Proton NMR of ethyl 3-chloropropanoate]] | [[File:Ethyl3ChloropropionateHNMR.gif|thumb|center|600px|Proton NMR of ethyl 3-chloropropanoate]] | ||
| − | + | {[File:Ethyl3chloropropanoate.png|200px|right]] | |
<quiz> | <quiz> | ||
| − | { Try to give predictions for chemical shift, integration (no. of Hs) and multiplicity (neighbors+1), then assign the peaks (1, 2, 3, 4) to a particular hydrogen type (a, b, c, d). You may well want to refer to the [[#Tables_of_chemical_shifts|chemical shifts table]]. | + | { Try to give predictions for chemical shift, integration (no. of Hs) and multiplicity (neighbors+1), then assign the peaks (1, 2, 3, 4) to a particular hydrogen type (a, b, c, d). You may well want to refer to the [[#Tables_of_chemical_shifts|chemical shifts table]]. |
|type="{}"} | |type="{}"} | ||
Hydrogen Type '''a''' | Hydrogen Type '''a''' | ||
Revision as of 12:30, 26 October 2009
This is a workshop introducing the basics of NMR spectroscopy for students of organic chemistry. It is taught as part of the Chemistry 341 course at SUNY Potsdam.
Contents
Introduction
Nuclear Magnetic Resonance (NMR) is a property of the nucleus of an atom, concerned with what is known as nuclear spin (I). This is equivalent to the nucleus acting like a miniature bar magnet. Although isotopes can have a variety of values for I (including zero), the most useful for spectroscopy are those nuclei which have I = 1/2 . Fortunately this includes hydrogen 1 (1H), carbon 13, fluorine 19 and phosphorus 31, so that some of the commonest elements in organic chemistry can be analyzed using NMR.
When a nucleus with I = 1/2 is placed in a magnetic field, it can either align itself with the field (lower energy) or against it (higher energy). If radio waves are applied, nuclei in the lower energy state can absorb the energy and jump to the higher energy state. We can observe either the absorption of energy, or the subsequent release of energy as the nucleus "relaxes" back to the lower energy state. Traditionally this was done by scanning slowly through a range of radio wave frequencies (this is called continuous wave, CW). However this has largely been replaced by the faster Fourier Transform (FT) method where one big, broad pulse of radio waves is used to excite all nuclei, then the results are analyzed by computer.
Chemical shift
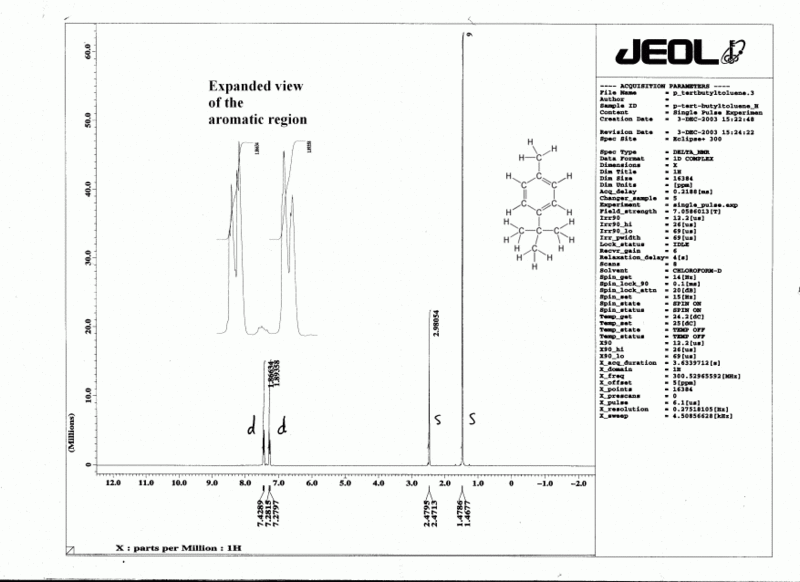
In a real molecule, the effective magnetic field "felt" by a particular nucleus (Beff) includes not only the applied field B0, but also the magnetic effect of nearby nuclei and electrons. This causes the signal to absorb at a slightly different frequency than for a single atom; it is convenient to reference this resonant frequency to a standard (usually tetramethylsilane, TMS, defined as zero). When we plot the output from this absorption, we obtain a series of peaks known as an NMR spectrum (or "spectra" if you have more than one spectrum) such as the typical example shown in Fig. 2. The difference (in parts per million, ppm) from the zero point is referred to as the chemical shift (δ). A typical range for δ is around 12 ppm for 1H and around 220 ppm for 13C. It is customary to have the zero point at the right hand end of the spectrum, with numbers increasing to the left ("downfield") as shown in Fig. 2. Typical chemical shift values are shown in Tables 1 & 2, and also Fig. 3.
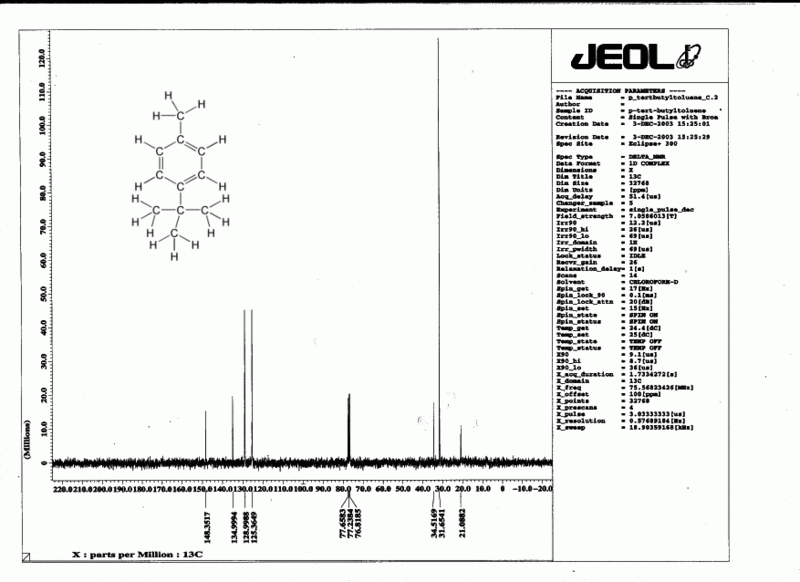
Examples of NMR spectra
Tables of chemical shifts
Table 1: Characteristic 1H NMR Chemical Shifts Type of Hydrogen
(R=Alkyl, Ar=Aryl)Chemical Shift*
(ppm)Type of Hydrogen
(R=Alkyl, Ar=Aryl)Chemical Shift*
(ppm)(CH3)4Si 0 (by definition) RCH3 0.9 RCH=O 9.5-10.1 RCH2R 1.2-1.4 RCOOH' 10-13 R3CH 1.4-1.7 RCOCH3 2.1-2.3 RCH2I 3.2-3.3 RCOCH2R 2.2-2.6 RCH2Br 3.4-3.5 RCOOCH3 3.7-3.9 RCH2Cl 3.6-3.8 RCOOCH2R 4.1-4.7 RCH2F 4.4-4.5 R2C=CRCHR2 1.6-2.6 RCH2NH2 2.3-2.9 R2C=CH2 4.6-5.0 RCH2OH 3.4-4.0 R2C=CHR 5.0-5.7 RCH2OR 3.3-4.0 RC(triplebond)CH 2.0-3.0 RCH2CH2OR 1.5-1.6 ArCH3 2.2-2.5 R2NH 0.5-5.0† ArCH2R 2.3-2.8 ROH 0.5-6.0† ArH 6.5-8.5
Table 2: Characteristic 13C NMR Chemical Shifts Type of Carbon
(R=Alkyl, Ar=Aryl)Chemical Shift*
(ppm)Type of Carbon
(R=Alkyl, Ar=Aryl)Chemical Shift*
(ppm)RCH3 10-25 RC(triplebond)CR 65-85 RCH2R 20-35 RCH=CHR 120-140 R3CH 25-35 ArylC 120-140 RCH2COR 35-50 RCOOR 160-180 RCH2Br 25-35 RCONR2
(amide)165-180 RCH2Cl 40-45 RCOOH 175-185 RCH2OH 60-70 RCHO 190-205 RCH2OR 65-70 RRCOR 200-215
When trying to predict the chemical shift for a particular hydrogen, the key to is to find the closest match in the table/chart. Sometimes there will be an exact match; often you will have to settle for something similar but not identical (for example, an RCH2X instead of an R2CH-X). Always bear in mind that the peak for a given hydrogen is moved downfield if there is a nearby electronegative element and/or pi system.
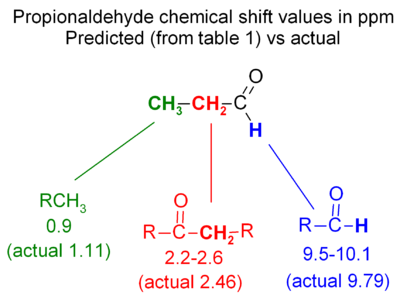
Propionaldehyde example
The basics of chemical shift prediction can be seen in propionaldehyde - the figure compared predicted values with actual chemical shifts. The hydrogen directly off the C=O carbon is moved far downfield; the next hydrogen is further away so it is only moved a moderate amount downfield; the most distant hydrogen is only moved a very small amount (0.2 ppm downfield from an alkane CH3).
Exercise 1
Exercise 1. Predict approximate chemical shifts for all the carbon and hydrogen atoms which are explicitly shown in the following molecules:
Once you've worked out the answers, click here to see my estimates.
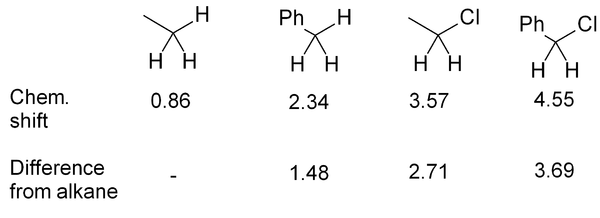
It should be noted that the positions given in Fig. 3 and Tables 1 & 2 may be only approximate, though for simple molecules they are fairly accurate. Where a wide range of δ is observed, this is indicated in Fig. 3 by use of a double-headed arrow showing the range. Additional nearby electron-withdrawing groups will tend to move the signals downfield. Nearby δ bonds may move the signal either upfield (rarely) or downfield (usually), depending on orientation. In 13C spectra steric factors can have a major effect.
If several functional groups are near to a hydrogen, they will each exert an effect, as in this series of related compounds:
Exercise 2
Exercise 2. Predict approximate chemical shifts for all the hydrogen atoms (don't bother with carbon here) which are explicitly shown in the following molecules:
Once you've worked out the answers, click here to see my estimates.
Equivalence
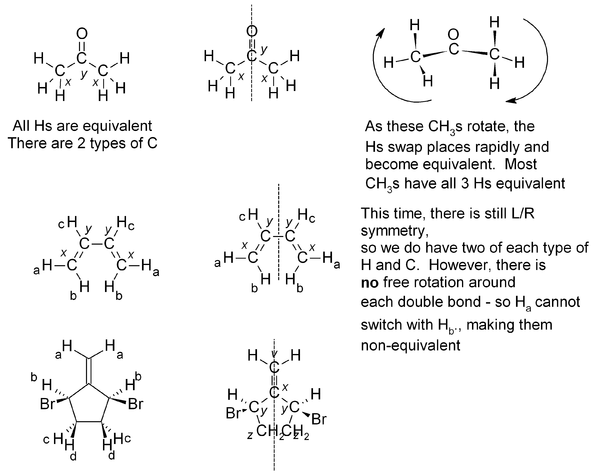
If two or more protons (or indeed with two or more carbons) are in an equivalent environment, then they will have the same chemical shift and appear as one signal. A common example of this is a CH3 group, where all three protons are always equivalent. In a CH2 group, the two protons are also equivalent, unless adjacent to a chiral center. Look for any plane of symmetry in the molecule, which will render the two halves equivalent. In the examples below, the different types of atom are given a subscript; atoms which are equivalent will have the same subscript.
Exercise 3. Predict how many peaks you would expect to see in the 1H and 13C NMR spectra of the following molecules:
The answers for this problem are now available.
Integration
A valuable aspect of 1H NMR is that the area under each peak is proportional to the number of hydrogens that are giving rise to that peak. (This is somewhat analogous to GC, where the area under each peak is proportional to the amount of substance giving rise to that peak.) A convenient way of analyzing these peak areas is to electronically "integrate" the peak, to convert the area into a distance. This distance is routinely printed onto a 1H NMR spectrum as a line, such that the vertical distance of the integration line is proportional to the number of hydrogens. We need to compare the ratios of these vertical distances, and from this we can find the ratio of the numbers of hydrogens. This ratio can be very helpful in determining the structure of an unknown substance using NMR, but be careful- integrations are only approximate!
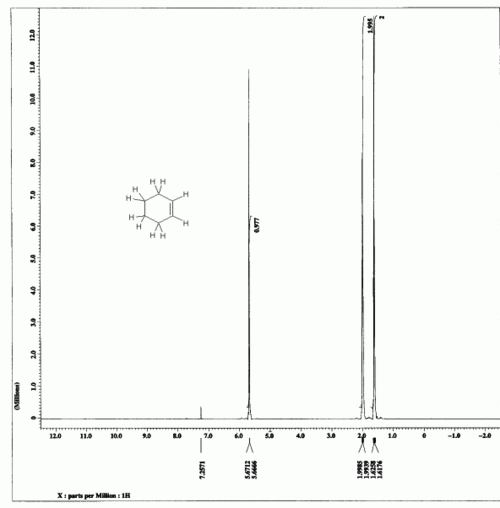
For example:- see cyclohexene and tert-Butyl 2-hydroxy-2-methylpropanoate.
Cyclohexene
The integration numbers given on the spectrum are 0.977:1.995:2.
tert-Butyl 2-hydroxy-2-methylpropanoate
Coupling (1H only)
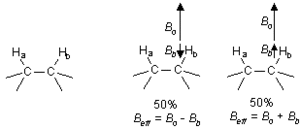
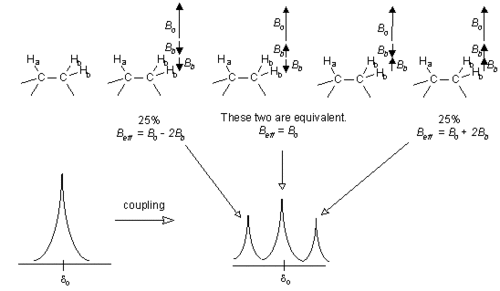
As mentioned in section 2 above, the chemical shift is determined by Beff, which is affected by nearby nuclei and electrons. However, the nearby nuclei are themselves being excited to the higher energy state by the radio waves. It turns out that any particular 1H will spend about 50% of the time in the lower energy state, and about 50% of the time in the upper energy state. Consider two neighboring protons in the following system:
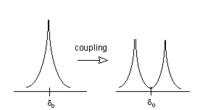
If we consider Beff for Ha, we will find that 50% of the time Hb will be increasing Beff for Ha (because Hb is aligned with the field), and 50% of the time Hb will be decreasing Beff for Ha (see above). The net result is that 50% of the signal for Ha will be shifted slightly downfield by Hb, while 50% of the signal for Ha will be shifted upfield by Hb. This process is called coupling, and it leads to a splitting of the signal into a doublet.
If now we turn to Hb, we will find that Ha has the exact same effect on Hb that Hb had on Ha. Thus the signal for Hb will be split by the same amount as Ha.
Now let us consider a more complicated system. If Ha has two neighboring Hb nuclei which are equivalent, the effect of these Hb nuclei may cancel out or not, as shown in the diagram below. This leads to the Ha signal being split into a triplet, with the three parts of the peak having areas in the ratio 1 : 2 : 1 (i.e., 25% : 50% : 25%). [However Hb will only be a simple doublet, as in the previous situation, because there is only one neighboring Ha affecting it.]
How do things work out in practice?
A. Hydrogens which are equivalent do not couple to one another (though they may couple to other nearby protons). A common effect of this is that 2 or 3 hydrogens attached to the same carbon do not usually split one another- thus an isolated methyl group always shows up as a singlet.
B. Only hydrogens which are attached to neighboring carbons usually couple to one another. Since only 1% of carbon is 13C, coupling of carbon is not seen in 1H spectra.
C. The "n + 1 rule", which says that if a proton Ha has n equivalent protons on neighboring carbons, then the signal for Ha will be split into n + 1 peaks. For example, a CH3 peak will split any "next door" proton signals into 4 peaks, called a quartet.
D. In a variant of the above rule, if Ha has m equivalent protons of type Hb and n equivalent protons of type Hc, all on neighboring carbons, then Ha will be split into (m + 1)(n + 1) peaks. Thus we see patterns such as a doublet of triplets, etc.
E. Because of hydrogen bonding, hydrogens attached to oxygen or nitrogen often give broad peaks, and they often do not couple to neighboring Hs. In some spectra they may not even be seen.
Exercise 4
Note: In your 2009 lab manual, this are printed later, on p68. Predict the coupling patterns in the following molecules. You do not need to assign chemical shifts - just indicate if something is a singlet, doublet, triplet, quartet or multiplet. Guided help is available for this exercise. You can see the answer for each H type by hovering the mouse over the hydrogens - but don't do this until you've tried doing them on your own! There is also an answer key.
Error: Image is invalid or non-existent.
Next, consider the examples given in the handouts. We will consider the following two structures in detail, and assign each hydrogen type (1, 2, 3, 4) to a particular peak (A, B, C, D) in the spectra.
Ethyl 3-chloropropanoate
{[File:Ethyl3chloropropanoate.png|200px|right]] <quiz> { Try to give predictions for chemical shift, integration (no. of Hs) and multiplicity (neighbors+1), then assign the peaks (1, 2, 3, 4) to a particular hydrogen type (a, b, c, d). You may well want to refer to the chemical shifts table. |type="{}"} Hydrogen Type a { 3.5-4.4 _3 } Predicted δ { 2 _1 } Integration { 3 _1 } Multiplicity { 2 _1 } Assignment Hydrogen Type b { 1.8-3.0 _3 } Predicted δ { 2 _1 } Integration { 3 _1 } Multiplicity { 3 _1 } Assignment Hydrogen Type c { 3.5-4.6 _3 } Predicted δ { 2 _1 } Integration { 4 _1 } Multiplicity { 1 _1 } Assignment Hydrogen Type d { 0.9-1.6 _3 } Predicted δ { 3 _1 } Integration { 3 _1 } Multiplicity { 4 _1 } Assignment
</quiz>
Ethyl 2-chloropropanoate
<quiz> { Try to give predictions for chemical shift, integration (no. of Hs) and multiplicity (neighbors+1), then assign the peaks (1, 2, 3, 4) to a particular hydrogen type (a, b, c, d). You may well want to refer to the chemical shifts table.
|type="{}"} Hydrogen Type a { 0.9-1.9 _3 } Predicted δ { 3 _1 } Integration { 2 _1 } Multiplicity { 3 _1 } Assignment Hydrogen Type b { 3.7-4.7 _3 } Predicted δ { 1 _1 } Integration { 4 _1 } Multiplicity { 1 _1 } Assignment Hydrogen Type c { 3.6-4.6 _3 } Predicted δ { 2 _1 } Integration { 4 _1 } Multiplicity { 2 _1 } Assignment Hydrogen Type d { 0.9-1.6 _3 } Predicted δ { 3 _1 } Integration { 3 _1 } Multiplicity { 4 _1 } Assignment
</quiz>
Decoupling a 13C spectrum
Since 13C makes up only 1% of natural carbon, coupling between carbon atoms is rarely observed. However coupling by nearby hydrogens would very often make 13C spectra very hard to read, so we routinely use a technique called decoupling to eliminate all coupling effects from all hydrogens. This is done by blasting the sample with radio waves which excite in the 1H region (this scrambles all of the hydrogens), while observing in the 13C region. There is a price to pay: integration can no longer be done accurately. However there is also a benefit: the hydrogens transfer some of their energy to the carbons and this improves the otherwise feeble absorption of energy by the 13C nuclei. A side effect of this is that carbons which have no hydrogens attached to them tend to be considerably smaller than the other carbons, and such carbons can easily be identified in a 13C spectrum.
Therefore in a decoupled 13C spectrum we see no coupling (except in the CDCl3 solvent, which is split into three peaks by the deuterium). This means that each carbon gives rise to a single sharp peak, and in a clear 13C spectrum the total number of such peaks (excluding TMS and solvent) is equal to the number of types of carbon in the molecule.
Putting it all together: determining a structure from an NMR spectrum
Interpreting an NMR spectrum is a skill acquired through much practice, and there are few hard and fast rules since every spectrum is different. However there are a few general guidelines which are usually helpful. I personally follow this procedure:
- If you have a molecular formula, determine the number of elements of unsaturation (see p274 of Wade 5th edition). This represents the number of double bonds + rings in the molecule. This is given by the formula
A nitrogen is counted as half a carbon, but oxygen and sulfur are not counted at all. A triple bond is equivalent to two double bonds. Note that a benzene ring has four elements of unsaturation- three double bonds + one ring.EOU = 1 + # carbons - 1/2(# hydrogens + halogens)
- Alternatively, if the starting material from which the sample was made is known, use this as a starting point- look to see which groups are unchanged.
- Measure the integration for each peak in the 1H spectrum. If you know the total number of hydrogens (from a molecular formula), you can use the total of all the integrations to work out the no. of mm per hydrogen. Use this to find out the number of hydrogens giving rise to each set of peaks.
- Aromatic rings: If you have one benzene ring (based on EOUs), how many aromatic Hs do you have? (These come around 6.5-8.5 ppm). Since one benzene can hold six attachments then you can work out the number of non-hydrogen groups attached to the ring, this is just 6-(# aromatic Hs).
- Alkyl hydrogens: A group that integrates to three hydrogens is almost certainly a methyl group (CH3). If the no. of hydrogens is a multiple of three such as six or nine, this is due to multiple CH3s. A group that integrates to
- Look for distinctive groups in the spectrum. For example, a sharp singlet (integration of 3H) at around 2 ppm is likely to be a CH3 which is next to a C=O, C=C or aromatic ring. A sharp singlet at around 0.8 ppm (integration of 9H) arises from a tert-butyl group, making this group a useful marker in chemical reactions. Learn to recognize other simple alkyl groups up to 4 carbons, particularly a simple ethyl (triplet for CH3 + quartet for CH2). The isopropyl group (doublet for the two CH3 s+ tiny peak for CH, split into 7) can be tricky, since the two equivalent but split methyl groups may easily be confused with two slightly different methyl groups. Peaks at around 3.5 - 4 ppm are likely to be adjacent to oxygen. Peaks above 7 are probably aromatic, but may possibly be vinylic if C=O groups (or similar) are nearby. If you see a pair of doublets between 7 and 8, this is most likely to be a para disubstituted aromatic ring (the only disubstitution pattern which is obvious). In 13C spectra, look for peaks above 160 ppm (C=O) and peaks around 60 ppm (C-O). Peaks above 100 ppm are sp2 carbons.
- Write down all of the fragments of the molecule that you can, then (if possible) consider what "barrier groups" are present (e.g. ketone C=O, ester or ether C-O). These groups act as barriers preventing coupling between protons on carbons either side of them. Remember too that a group attached to an aromatic ring will not be coupled to the aromatic protons. Taking into account all of these barrier groups, and the chemical shifts & coupling patterns, you should be able to assemble all of your fragments into a complete structure.
