The greenhouse effect and global warming
| Experiments related to climate change |
|---|
| Experiments on: |
| For teachers |
| For students |
| For technicians |
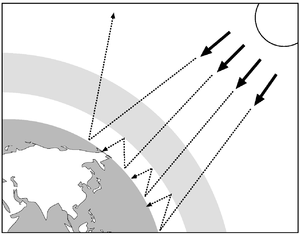
A garden greenhouse keeps plants warmer than they would be outside. It does this because the glass traps some of the Sun’s radiation energy. The atmosphere keeps the Earth warm in a similar way. Without the greenhouse effect the earth would be about 33 °C cooler than today’s pleasant average of 15 °C. Greenhouse gases include carbon dioxide, oxides of nitrogen, methane, chlorofluorocarbons (CFCs) and water.
- Questions
- If the greenhouse effect did not exist, what would the normal temperature of the earth be?
- What do you think is meant by global warming?
- List all the things you can think of that give off greenhouse gases – eg cars.
Looking at the data
Temperature changes over the last century
For more information see the USAEPA website.
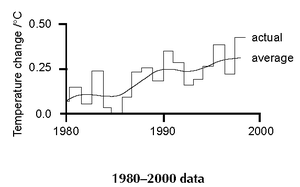
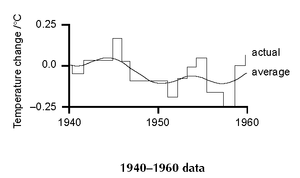
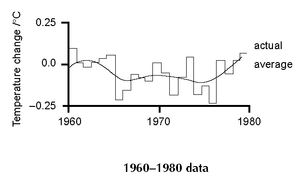
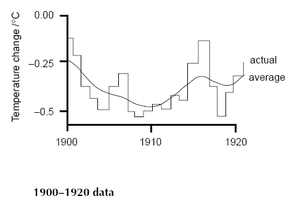
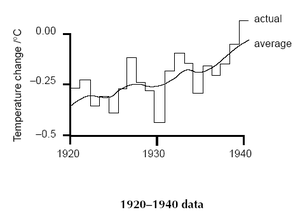
Study the graphs, published by the International Panel of Climate Change (IPCC) and then answer the questions. These are temperatures above and below the average for the period 1961–1990.
- 1980–2000 data
|
| Global average temperatures for 1980-2000 |
- Describe how the temperature of the earth has changed over the period 1980-2000.
- By how much has the temperature changed in that period?
- Draw a sketch graph to show what you expect the average temperature to change by over the twenty years from 2000–2020.
|
|
| Global average temperatures for 1940-1960 | Global average temperatures for 1960-1980 |
- 4. Compare how the temperature of the earth changed between 1960 and 1980 and between 1940 and 1960.
- 5. Based on the new information from question 4, draw a second sketch graph to show what you expect the temperature to change by over the twenty years, 2000–2020.
|
|
| Global average temperatures for 1900-1920 | Global average temperatures for 1920-1940 |
- 6. Compare how the temperature of the earth changed between 1920 and 1940 and between 1900 and 1920.
- 7. Based on the new information from question 6, draw a third sketch graph to show what you expect the
temperature to change by over the twenty years 2000–2020.
- 8. Has the overall temperature of the earth increased over the last century? (Use the data above to support your
answer.)
- 9. Based on the temperature changes over the whole of the 20th century, which of your sketch graphs is most likely
to be correct?
- 10. Do you think that you have enough evidence to support a firm conclusion to your answer to question 9?
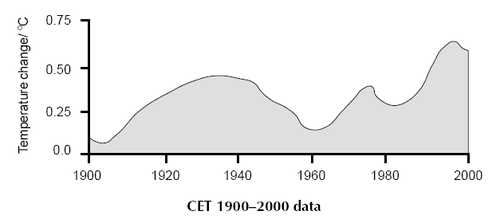
When looking for answers scientist usually analyse data from more than one source if they can. The following graph comes from the Central England Temperature (CET) record. This record goes back to 1660 when instruments were first used to record temperatures. Annual temperatures are recorded here.
|
| Central England temperatures for 1900-2000 |
